
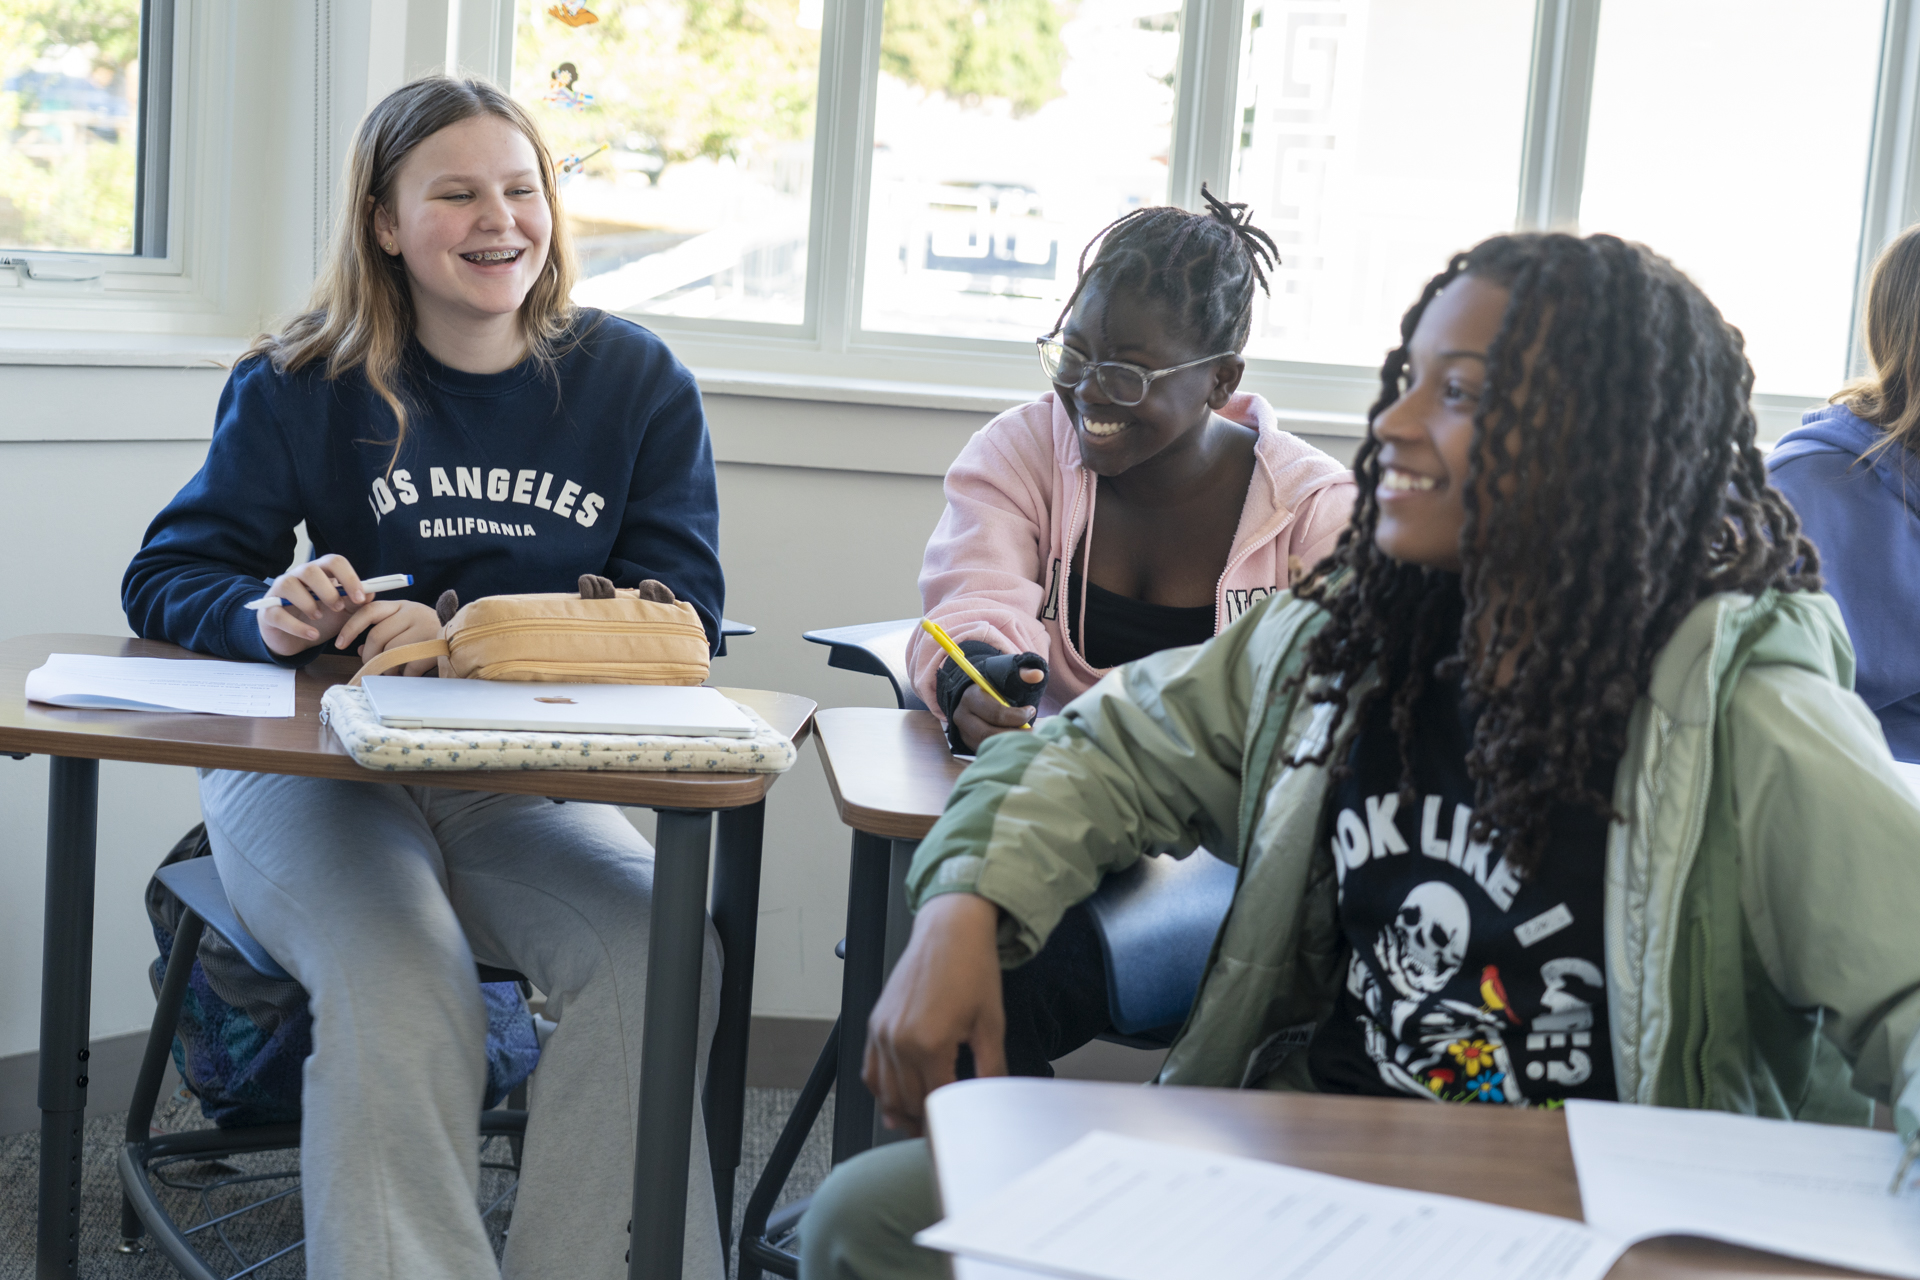
In Algebra B last month, the question was simple: how do you make inequalities feel like more than just symbols on a worksheet? The answer, according to math teacher Kristen Amouri, is to give students a problem worth solving, one rooted in curiosity, choice, and real data. “Inequalities can be really cool comparison tools,” she explains, “with more levels of challenge and nuance than I think we’ve realized.” Through the Compound Inequality Survey Project, students learned that these mathematical comparisons are useful and powerful when applied to questions they care about.
Students began the project by learning to distinguish between qualitative and quantitative data. Then they developed questions to ask their peers, such as shoe size, books read, pets owned, siblings, or years attending Field. Posing questions in person introduced students to the social dimension of research: “How does a statistician get data? What does it feel like to ask somebody, ‘Hi, I’m doing a survey for math class…?’” This simple act of approaching a peer becomes a step toward mathematical agency.
Once the numbers were collected, students returned to the classroom to turn raw data into math. Each student represented their findings three ways: a clear sentence using precise math language, a number line graph, and a compound inequality such as 3 < x < 17. This movement between representations: verbal, visual, and symbolic, is a foundational skill in algebra and a significant focus of the course. Kristen says the challenge is in the shift in thinking, “If you have a graph, how do you turn it into a sentence? How do you move from one representation of a problem to another?” These shifts demand clarity, accuracy, and thoughtful reasoning from middle school students.
Alongside the math, students noticed limitations of their data. Who did they ask? Who didn’t they ask? How might a sixth grader answer differently when an eighth grader is standing in front of them? These conversations give students an early understanding of bias and sampling, core ideas in statistical thinking. “How does the way we sample, who we ask, change the data that we get and what we see?” Kristen says. Students are guided to consider how data can be shaped by human choices.
Throughout the project, students are on their feet, gathering evidence, testing ideas, and explaining their conclusions. “You are not frowning at a worksheet. You are up, you are doing, you are analyzing,” Kristen says. This activity lays the groundwork for the Quilt Block Project, which they will complete this month, where they learn to graph inequalities in two variables on a coordinate plane, creating mathematically-derived art displays.


.jpg&command_2=resize&height_2=85 "Graphing Quilt Blocks in Middle School Math")


