
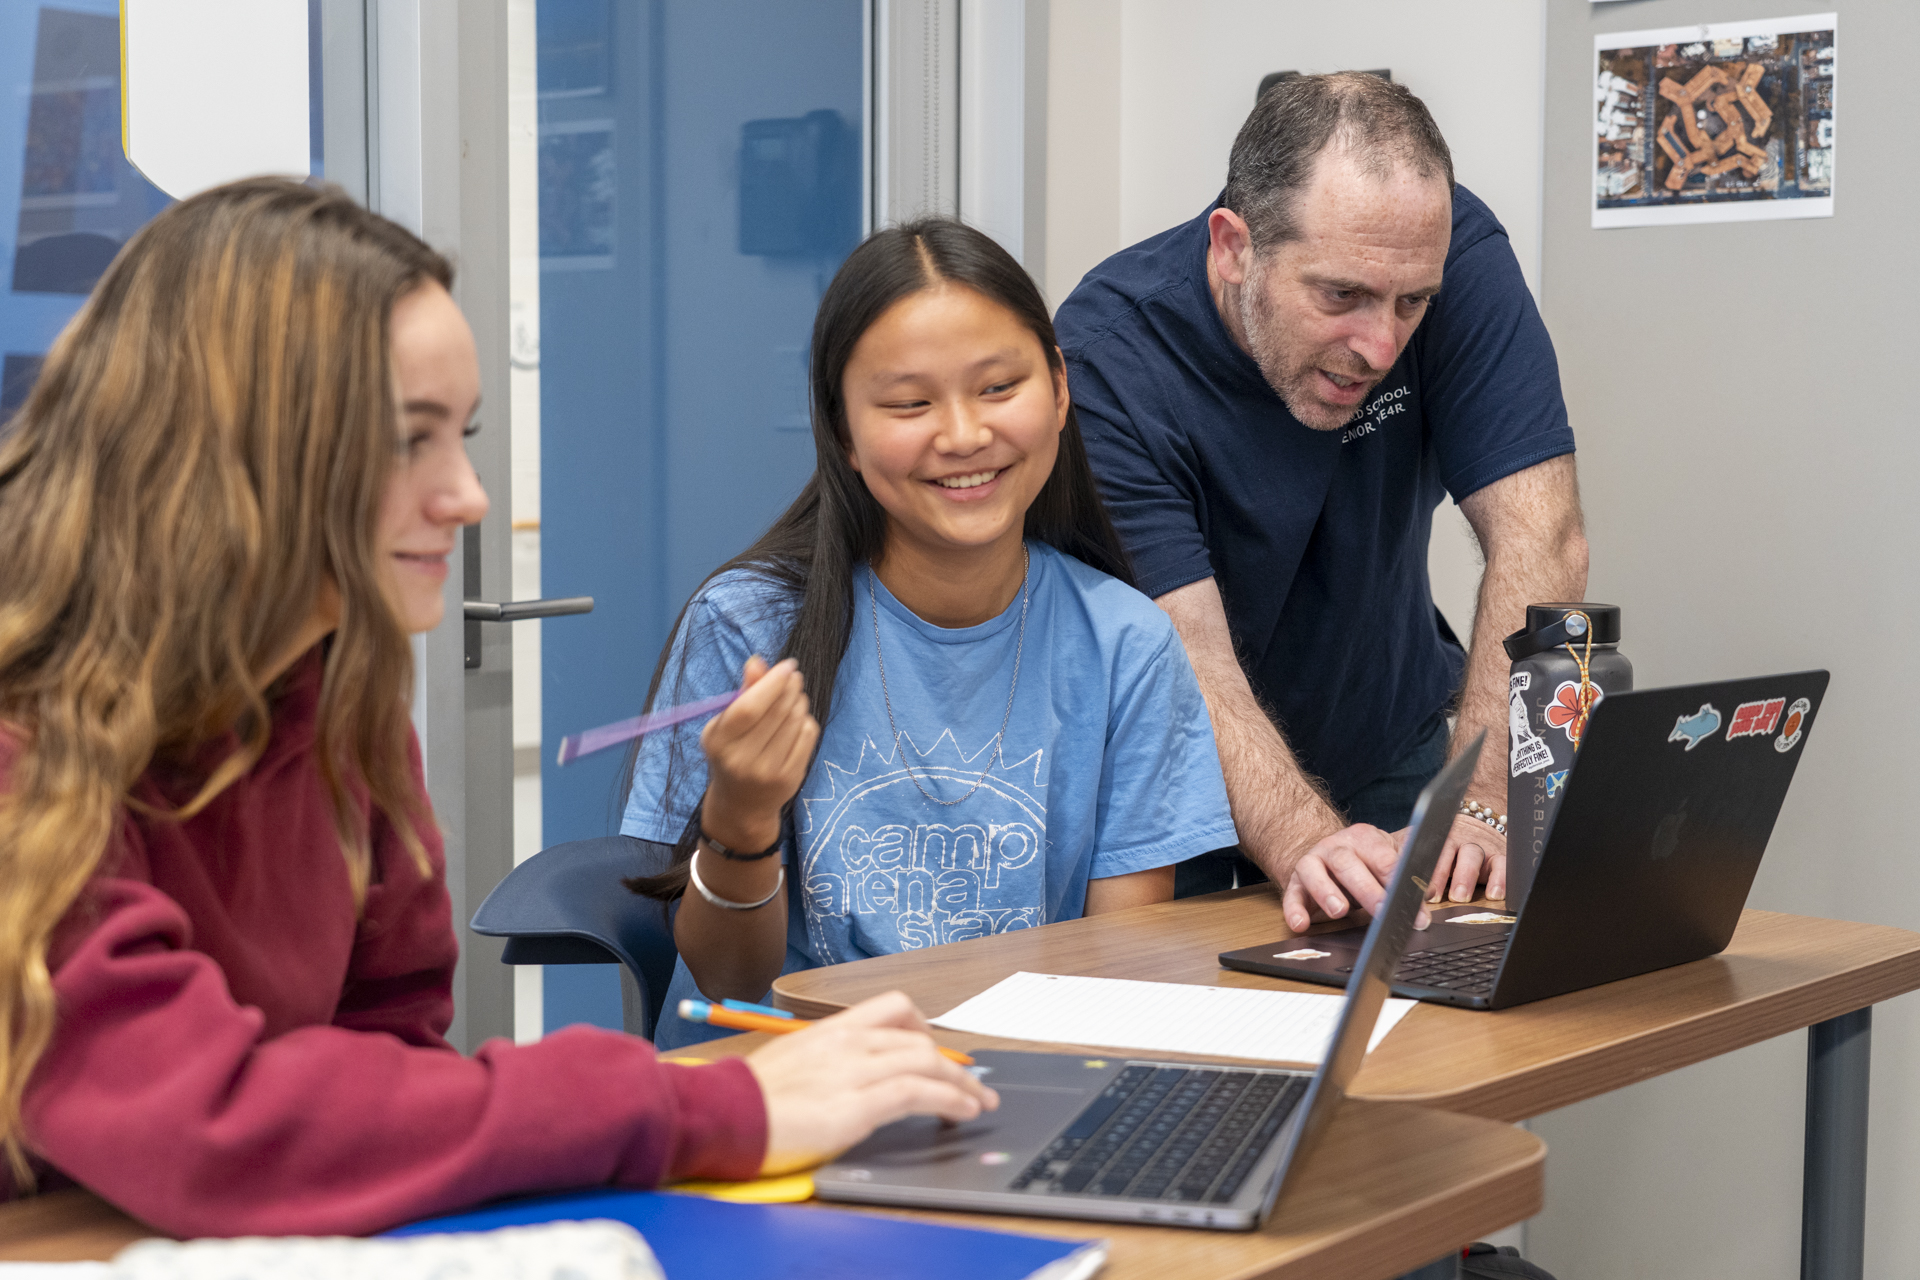
Walking into Analytical Algebra 2 during the baseball stadium project, students are working toward a singular challenge: design a baseball hit that clears the back of the stands at PNC Park and splashes into the Allegheny River. To get there, upper school students must master three forms of quadratic equations: vertex, standard, and factored, each revealing different information about a ball’s flight. Math teacher Jake Hirsch explains that vertex form shows the highest point the ball reaches, standard form shows the ball's height when the bat makes contact, and factored form shows where the ball will land. The goal is simple, but the path requires precision, strategy, and a deep understanding of how equations model real-world motion.
This project builds skills incrementally. Students start by analyzing pre-made baseball trajectories to understand how each equation form works. Then they are given constraints: their ball cannot exceed 75 feet in height, travel farther than 475 feet, and must clear stadium structures before reaching the water. Using the Desmos graphing website, students adjust coefficients with sliders and watch in real time how tiny changes alter a ball’s arc. Jake notes, “You’re dealing with a coefficient down to the thousandth place of the decimal to get it to actually do what you’re trying to get it to do.”
Students also tackled stadium-specific challenges, like creating a hit that would be a home run in one direction at Fenway Park but not in another, thanks to the various heights and distances of the “Big Green Monster” (wall) surrounding the park. Or, working with the constraints of playing in a dome, because the roof gets in the way if you hit the ball high enough. “I found an equation that was easy to work with and from there I realized I can just toy with this little by little,” Thomas ’28 reflected.
What makes the project powerful is how it teaches students to choose the right mathematical tool for each question. Rather than following a single procedure, Jake explains, students must ask themselves: “I have lots of tools in math, which one should I use here? Which one is going to be the most efficient, and why is it the most efficient?” Sitting with the problem at hand, this line of questioning builds critical thinking skills. If they want to know the highest point, a vertex form shows it immediately. If they need the landing distance, factored form is the answer. They organize their work in Desmos folders, create visual elements, such as vertical lines representing stadium walls, and annotate their graphs so others can follow their reasoning.
By the time students send their virtual baseball into the river, they’ve learned to use mathematics as a tool for understanding motion, change, and constraint in the world around them. The baseball context provides an accessible entry point, but the real learning is about mathematical modeling itself. “I liked the choice of it, how it was structured. There is not that much fluidity in math,” said Thomas ’28.
Students began with a universal challenge for the class and then built their own, creating original equations and choosing other stadiums to pose the challenge, where a hit down the center field line would be a home run, but not in left or right fields. Building student agency within a subject and lesson is core to how Field educates students. It’s essential for them not just to solve the equation they are given, but to recognize everyday opportunities to use math to answer their curiosities.


.jpg&command_2=resize&height_2=85 "Nate ’27 Wins Silver Medal in Scholastic Arts Competition")


.jpg&command_2=resize&height_2=85 "Students Design Legacy Posters for Civil Rights Journey")


